Following on from my last post, I’ve been working to track and control the conditions in my tea storage boxes. Initially, I got some cheap units from Amazon. They were basically a humidity/temperature sensor, an LCD display, and a battery. But since I don’t just sit in the basement staring at my tea shelf, I wanted to upgrade to a solution that let me transmit that data to view it more easily.
Step 1: fancier hygrometers
To start, I had to swap out my boring cheapo hygrometers. I did some searching, with a couple criteria:
- Needs to be able to send data to a base station
- Needs to seem reasonably accurate
- Needs to support enough channels for a shelf’s worth of storage bins
- Should ideally support calibration in case it seemed totally out of whack
Baed on that, I landed on the WS-3000 base station. It ships with a variable number of sensors, but supports up to 8 channels. The sensors arrived, and were pretty straightforward to set up. They have dipswitches to set the channel, and I used command strips to stick them to the inside of my storage bins.
At this point, I had the base station reporting data from 5 of my bins.
Step 2: exporting the data
When I placed the order, I had vague thoughts about using the base station’s USB interface to export temp/humidity data. I poked at that a bit, but it seemed painful. I happened to stumble on a note saying that the sensors (which are sold standalone as the “WH31E” device) communicate via radio signals with the base station. After some googling, I figured out the sensors broadcast on 915Mhz, and it turns out folks have already done the legwork to decode the message format.
I ordered an RTL-SDR. I already had a Raspberry Pi, so I dropped a fresh Linux image on it. From there, I did some quick bootstrapping to clean up unnecessary cruft and update the system:
apt update
apt upgrade

systemctl disable alsa-state
systemctl stop alsa-state
systemctl disable avahi-daemon
systemctl stop avahi-daemon
systemctl disable triggerhappy
systemctl stop triggerhappy
systemctl disable wpa_supplicant
systemctl stop wpa_supplicant
Then I built the rtl_433 and set up a quick config file to dump WH31E events to a file:
apt install libtool libusb-1.0-0-dev librtlsdr-dev rtl-sdr build-essential autoconf cmake pkg-config git

git clone https://github.com/merbanan/rtl_433 /opt/rtl_433
(
  cd /opt/rtl_433
  mkdir build
  cd build
  cmake ..
  make
  make install
)

cat <<EOF > /usr/local/etc/rtl_433/rtl_433.conf
frequency 915M
output json:/opt/data/signal.json
protocol 113
report_meta time:utc
EOF

mkdir /opt/data

cat <<EOF > /etc/systemd/system/sdr.service
[Unit]
Description=RTL-SDR collection
[Service]
ExecStart=/usr/local/bin/rtl_433
Restart=always
[Install]
WantedBy=multi-user.target
EOF

systemctl enable sdr
systemctl start sdr
From there, I could monitor the temperature and humidity readings from anywhere in my house, just by SSHing to the Pi and checking the /opt/data/signal.json log file.
Step 3: visualizing the data
Reading the log file was fun, but I really wanted to be able to plot the data on pretty charts. I had 2 constraints:
- I wanted to be able to see the pretty charts from anywhere
- I wanted the ability to set up alerts for if the readings skewed outside expected bounds (to help avoid accidentally scorching or soaking my tea)
I also really didn’t want to have to run my own infrastructure.
I did some quick searching, and also reviewed the supported output formats for rtl_433. Initially, I noticed that InfluxDB was a supported output, and InfluxData offers a free plan for cloud-hosted InfluxDB. I set up rtl_433 to ship data to my free account, and… it didn’t ever show up. I did some debugging, and found the issue: rtl_433 only supports HTTP for InfluxDB, and the cloud-hosted InfluxDB only works over HTTPS. As a quick hacky fix, I stood up an Nginx server on the Raspberry Pi that just accepted connections on localhost and proxied them to InfluxDB’s cloud instance. That let rtl_433 talk on localhost via HTTP, and Nginx handled adding encryption to the next leg of the connection. Here’s the nginx config I used:
server {
    listen 127.0.0.1:80;

    access_log /var/log/nginx/access.log;
    error_log /var/log/nginx/error.log;

    location / {
        proxy_pass https://us-west-2-1.aws.cloud2.influxdata.com;
        proxy_set_header Authorization "Token <REDACTED>";
    }
}
And it worked! I got cute charts in InfluxDB.
Step 4: cleaning up the data
Well, I had charts. But they were strictly the data that rtl_433 was pulling off the radio waves. So I knew that “Channel 1” was at “20.1 Celsius”. But I was stuck keeping a text file decoder ring to remind myself that “channel 1” was the box of Raw Puer tea, and I kept having to do conversions from Celsius to Fahrenheit. I figured the easiest way to clean up the data would be to write a lightweight service to consume from rtl_433 and submit the data to InfluxDB. One upside of that approach is that it would let me remove Nginx, since my enrichment service could handle the HTTPS data upload.
I wanted a simple interface between rtl_433 and my service, so I decided to use rtl_433’s syslog output. The tool is a quick golang binary. It spins up a syslog server, and when it gets a message, it parses it as an rtl_433 event, does some conversions to allow mapping of sensor IDs to names and Celsius to Fahrenheit, and submits the event to InfluxDB.
Setting up the service and config on the Pi was pretty straightforward:
curl -sLo /usr/local/bin/wh31e_metrics 'https://github.com/akerl/wh31e_metrics/releases/download/v0.0.3/wh31e_metrics_linux_arm'
chmod a+x /usr/local/bin/wh31e_metrics

cat <<EOF > /usr/local/etc/wh31e_metrics.conf
influx_url: https://us-west-2-1.aws.cloud2.influxdata.com
influx_token: TOKEN
influx_org: ORG_ID
influx_bucket: BUCKET_NAME
syslog_host: 127.0.0.1
syslog_port: 1514
sensor_names:
  SENSOR_ID: HUMAN_NAME
EOF

cat <<EOF > /usr/local/etc/rtl_433/rtl_433.conf
frequency 915M
output json:/opt/data/signal.json
output syslog:127.0.0.1:1514
protocol 113
report_meta time:utc
EOF

cat <<EOF > /etc/systemd/system/wh31e_metrics.service
[Unit]
Description=Syslog to InfluxDB forwarder
[Service]
ExecStart=/usr/local/bin/wh31e_metrics /usr/local/etc/wh31e_metrics.conf
Restart=always
[Install]
WantedBy=multi-user.target
EOF

systemctl enable wh31e_metrics
systemctl start wh31e_metrics
systemctl restart sdr
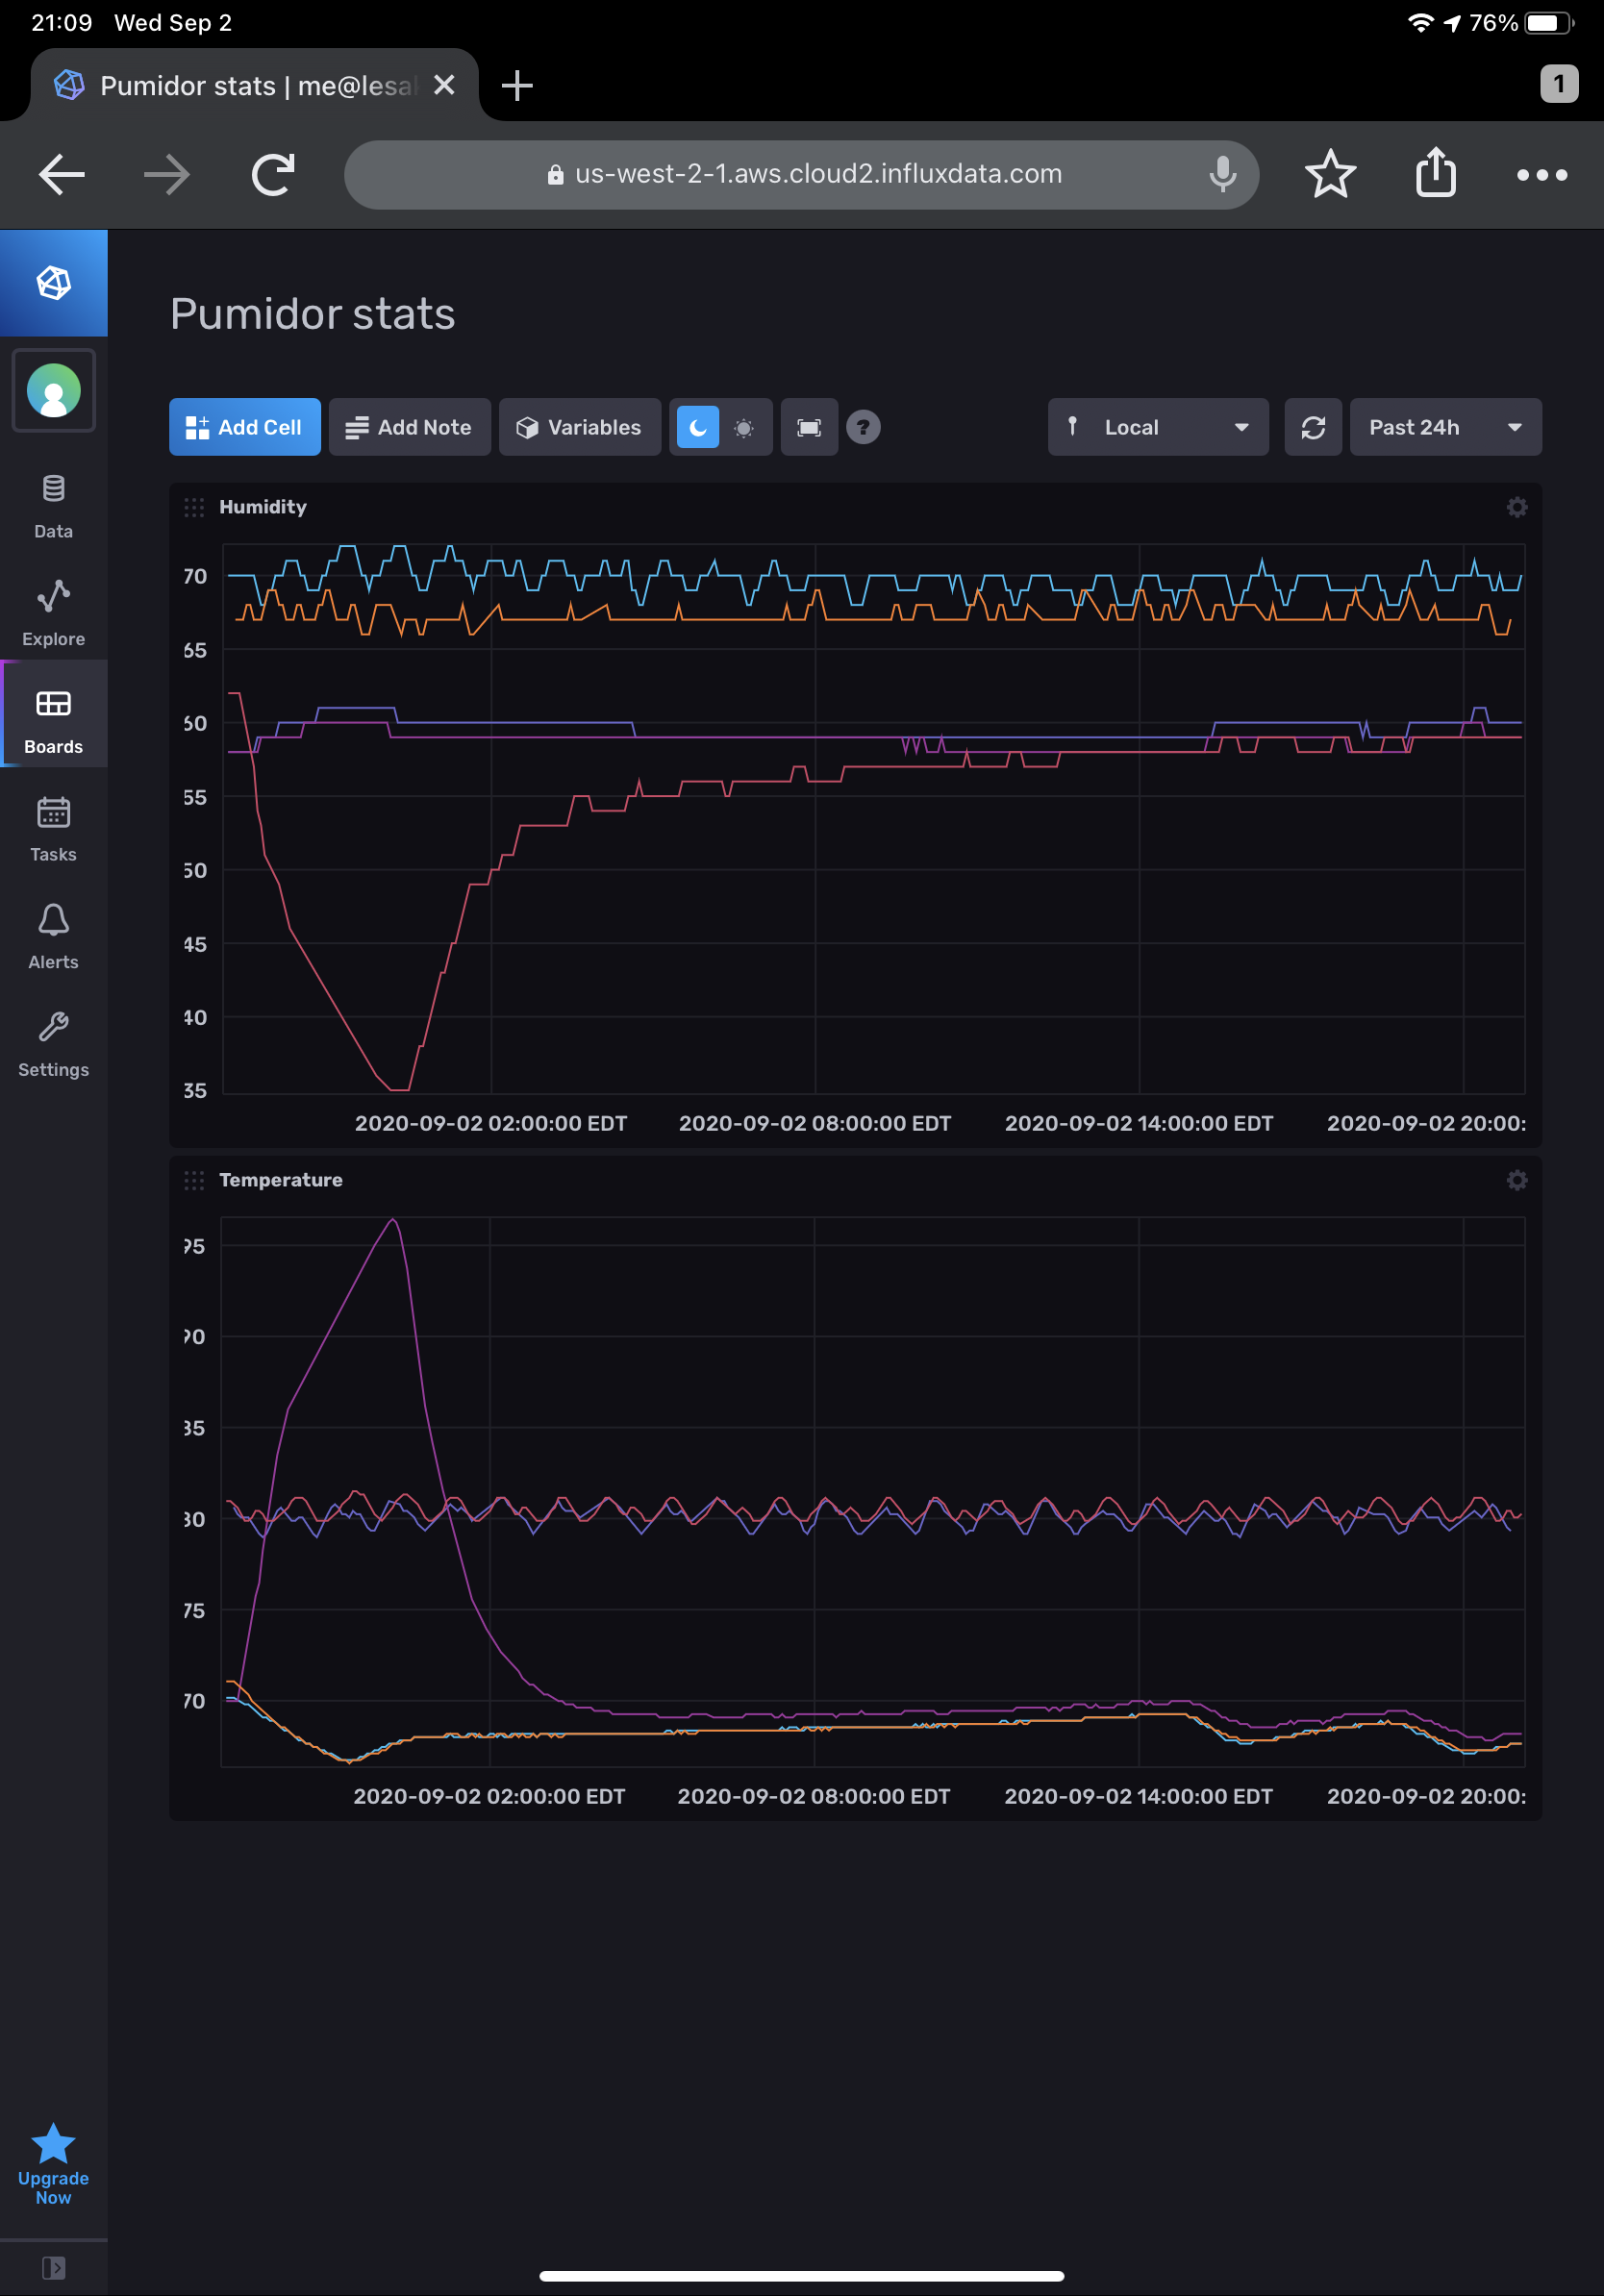
Launching that gave me the graphs I was looking for!
Step N: more stuff?
Now that I’ve got the graphs working, I’m learning my way around InfluxDB to set up alerts. Ideally, I want to get notified by temp or humidity swings. It also looks like the sensors emit a battery level metric, so I should be able to get alerts for low batteries.
After that, I’m tempted to set up a spare monitor so I can have a more featureful tea sensor display than the stock WS-3000 base station.